Eye of the Hurricane
Column #387 January 27, 2023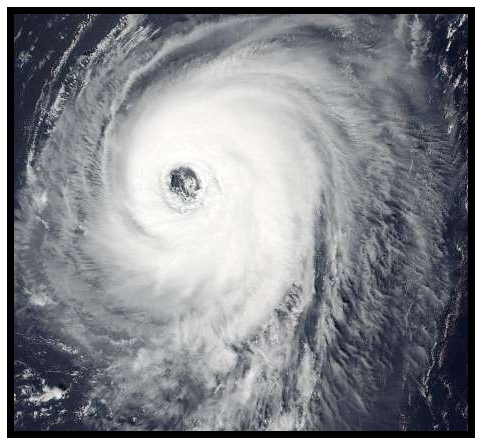
Everyone is feeling better now. Stock prices started rebounding in mid-October after a very rough ten months of sagging prices. With a small delay bonds joined stocks and also increased in price—which meant long-term interest rates finally declined a little. This positive market action generated today’s period of euphoria and predictions of an end to the Fed’s tight money and high interest rate policies. But is the giddy reaction premature?
The simple answer is . . . “Yes because we’re merely in the eye of a hurricane.”
The Federal Reserve Bank of St. Louis has an amazing database of financial and economic information in a graphical format. It’s called “FRED.” This chart of the M1 Money Supply is a terrific example of what’s available from FRED.
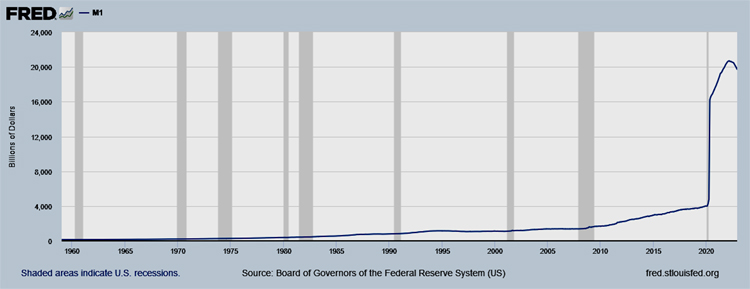
The numbers on the left scale are in billions of dollars. So, that means in January 2020 there was $4,000 billions of M1 dollars. That’s $4 trillion outstanding up from the $1.4 trillion outstanding in June 2008—the year the money crunch nearly turned the lights out on the entire country.1
You can hardly see it, but in 1980 M1 was only $386 billion. That means M1 increased $1 trillion over 28 years (or $35 billion per year) between 1980 and 2008. In perspective the $2.6 trillion increase in M1 from 2008 to 2020, which was $217 billion per year, was really wild. But that 12-years of wild money pumping was nothing compared to what happened between January 2020 and today. Yes, in the past two years M1 increased from $4 trillion to $19.9 trillion which is $8 trillion per year. Compare that to our nation’s gross domestic product of $25.7 trillion per year. That means the annualized growth of M1 exceeded 30% of all economic activity!
About half of the M1 increase was because the Federal Reserve Bank (Fed) funded the Federal government’s deficit spending and some of the private sector’s wild borrowing and bingeing. The other half of M1 growth came from the fractional reserve banking system which also creates dollars when consumers get consumptive loans for things such as education, cars, planes, boats, cell phones, homes, furniture, and stuff. The “rapid expansion of dollars for consumption waters down the supply of outstanding dollars” and that is the classical definition of “inflation.” The SYMPTOM of inflation is rising prices for all things such as we’ve been experiencing these past 12 months.2
Compared to all economic activity the expansion of M1 has been so excessive that the reported 8% consumer price inflation rate does not yet totally reflect how much the dollar has been watered down. So, in order to slow price inflation to 2% per year, the Fed must either shrink the M1 supply rather quickly in the short-term or spend decades strictly limiting its growth. The latter course means that the purchasing power of the dollar will keep on shrinking at an alarming pace for a long time. The former is risking a depression.
M1 grew because the Fed and the commercial banking system printed dollars to fund consumption. If M1 is to shrink, debts must be reduced. On the way up everyone is earning money and borrowing more money in order to spend way over their heads. It’s called boom times and it’s like a drunken orgy of consumption. When M1 is shrinking, earnings are being used to pay down debts while debts are not being incurred to buy additional stuff. This contracts economic activity which is recessionary. If the contraction gets out of hand, it’s called a depression.
It’s interesting that right now politicians are arguing about raising the nation’s debt limit so they can spend more just like they’ve been doing for decades. Well, if they raise the debt limit and the Fed buys the government’s bonds, then that is inflationary. That will cause prices to go up as the dollar supply is watered down. Additionally, even an idiot understands that more debt is not stronger debt. More debt is weaker debt. Weaker debts lead to bankruptcy. It can’t be any simpler than that. Therefore, if price stability is a goal, the M1 supply will have to be reduced.
The Fed’s only tool for shrinking M1 is to slow down and stop the consumptive borrowing binge. It does that in two ways. First it raises interest rates to discourage borrowing. That’s like tapping on the brakes. If that doesn’t work, then it pushes short-term interest rates above the rates on the long end. That’s way beyond tapping the brakes, that’s locking the brakes.
When one-month interest rates were near zero, everyone wanted to borrow and consume stuff. But after interest rates increased, the higher interest costs started to discourage more borrowing such as taking on mortgages for homes. When the one-month rates exceeded the 30-year rates that really put the brakes on lenders and entities that have relied on borrowing cheap money in the short-term market. That’s because as the low-cost short-term loans come due the cheap debts roll over into much higher cost debts which many marginal borrowers can’t afford. The vulnerable borrowers can quickly face bankruptcy.
Here’s how interest rates have changed in the past. Take note regarding how one-month rates have cycled from 0% to nearly 5% in recent cycles.3
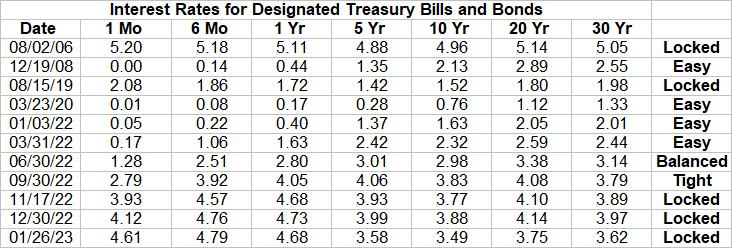
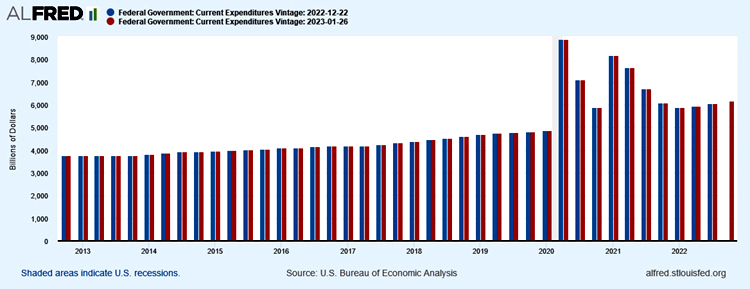
Following the pandemic shutdown in early 2020, easy money became a “permanent” policy. It was still in effect in January 2022 when one month T bills paid 0.05% interest and 30 year bonds paid 2.01%. This encouraged the government, corporations, and individuals to borrow money like there was no tomorrow. Short-term money was nearly free and 30-year mortgages were 3.25%. For several years there the Federal government and many corporations borrowed a lot of money on the short end. As those loans roll over the borrowers are being forced to pay much higher rates. As that happens, interest expense becomes a much bigger portion of the borrowers’ annual budget at the expense of their other programs.
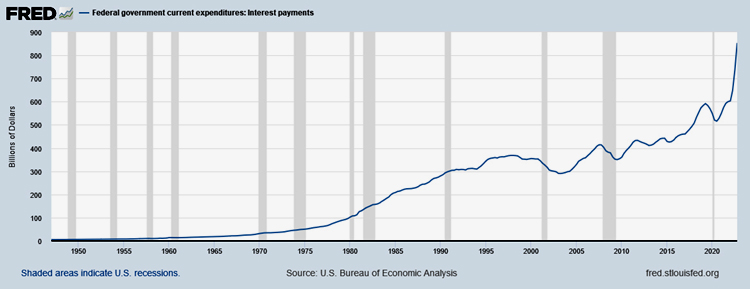
This FRED chart shows how the increase in interest payments is eating the government’s lunch. Take note that the U.S. government's total revenue is estimated to be $4.71 trillion for FY 2023. Therefore, interest expense is nearing 20% of gross revenue.
Interest rates started increasing in April 2022. It wasn’t until November 2022 that the shortest term rates finally exceeded the 30-year rates. This locked the monetary brakes. When that occurred, the Fed was able to let longer-term rates sag down to less than what they were in September 2022. Everyone saw the drop in longer-term rates and this is why investors believe that the return to boom times is just around the corner. Yet, in reality, the brakes are still locked.
We can look back at the last two times short rates exceeded long rates. In 2019, just before the pandemic shutdowns in 2020, economic activity was overheating. Rates were increasing and from mid-August 2019 to early September 2019, for less than one month, short rates moved above long rates. But that was leading into an election year so rates stayed rather low. Then the pandemic hit and everyone went crazy which led to the everything bubble which exploded into price increases across the board and the reasons for today’s tight money conditions.
For nine months, August 2006 to April 2007, short term interest rates also exceeded long rates. That was the Fed’s response to the wild, 2005- to 2006-real-estate boom. Even though the rates started moderating in May 2007, and had really plunged to record lows by early 2008, the stock market, which peaked in October 2007, then plunged 56% to bottom in March 2009. As you can see, it took some time for the lower rates to help. In fact most of the bad times occurred while interest rates were plunging.
The point here is that the monetary brakes are currently locked. For how long we don’t know. So far, the short end has been above the long end since November 17, 2022 or a little over two months. But the response the Fed is seeking is no growth in consumptive borrowing in order to reduce the price inflation rate to near 2%. That’s just starting to happen. If the Fed gives up the fight right now, speculation will return with a vengeance. Therefore this is still a good time to accumulate cash and play it safe.
Why should one accumulate and hold dollars? Because as debtors come under pressure to service their debts, if their cash flow is insufficient, they must liquidate assets to service their dollar-denominated debts. That’s why the prices of assets such as stocks, real estate, gold, bonds, crypto, boats, airplanes, collectibles, and such are vulnerable.
The idea here is that, just like your physical health is important, your financial health also matters.
To your health.
Ted Slanker
Ted Slanker has been reporting on the fundamentals of nutritional research in publications, television and radio appearances, and at conferences since 1999. He condenses complex studies into the basics required for health and well-being. His eBook, The Real Diet of Man, is available online.
For additional reading:
1. FRED M1 Money Chart from Federal Reserve Bank of St. Louis
2. Fractional Reserve Banking: What It Is and How It Works by Scott Nevil from Investopedia


